
Opus1.io Research · 2026 Edition · Releasing November 12, 2026
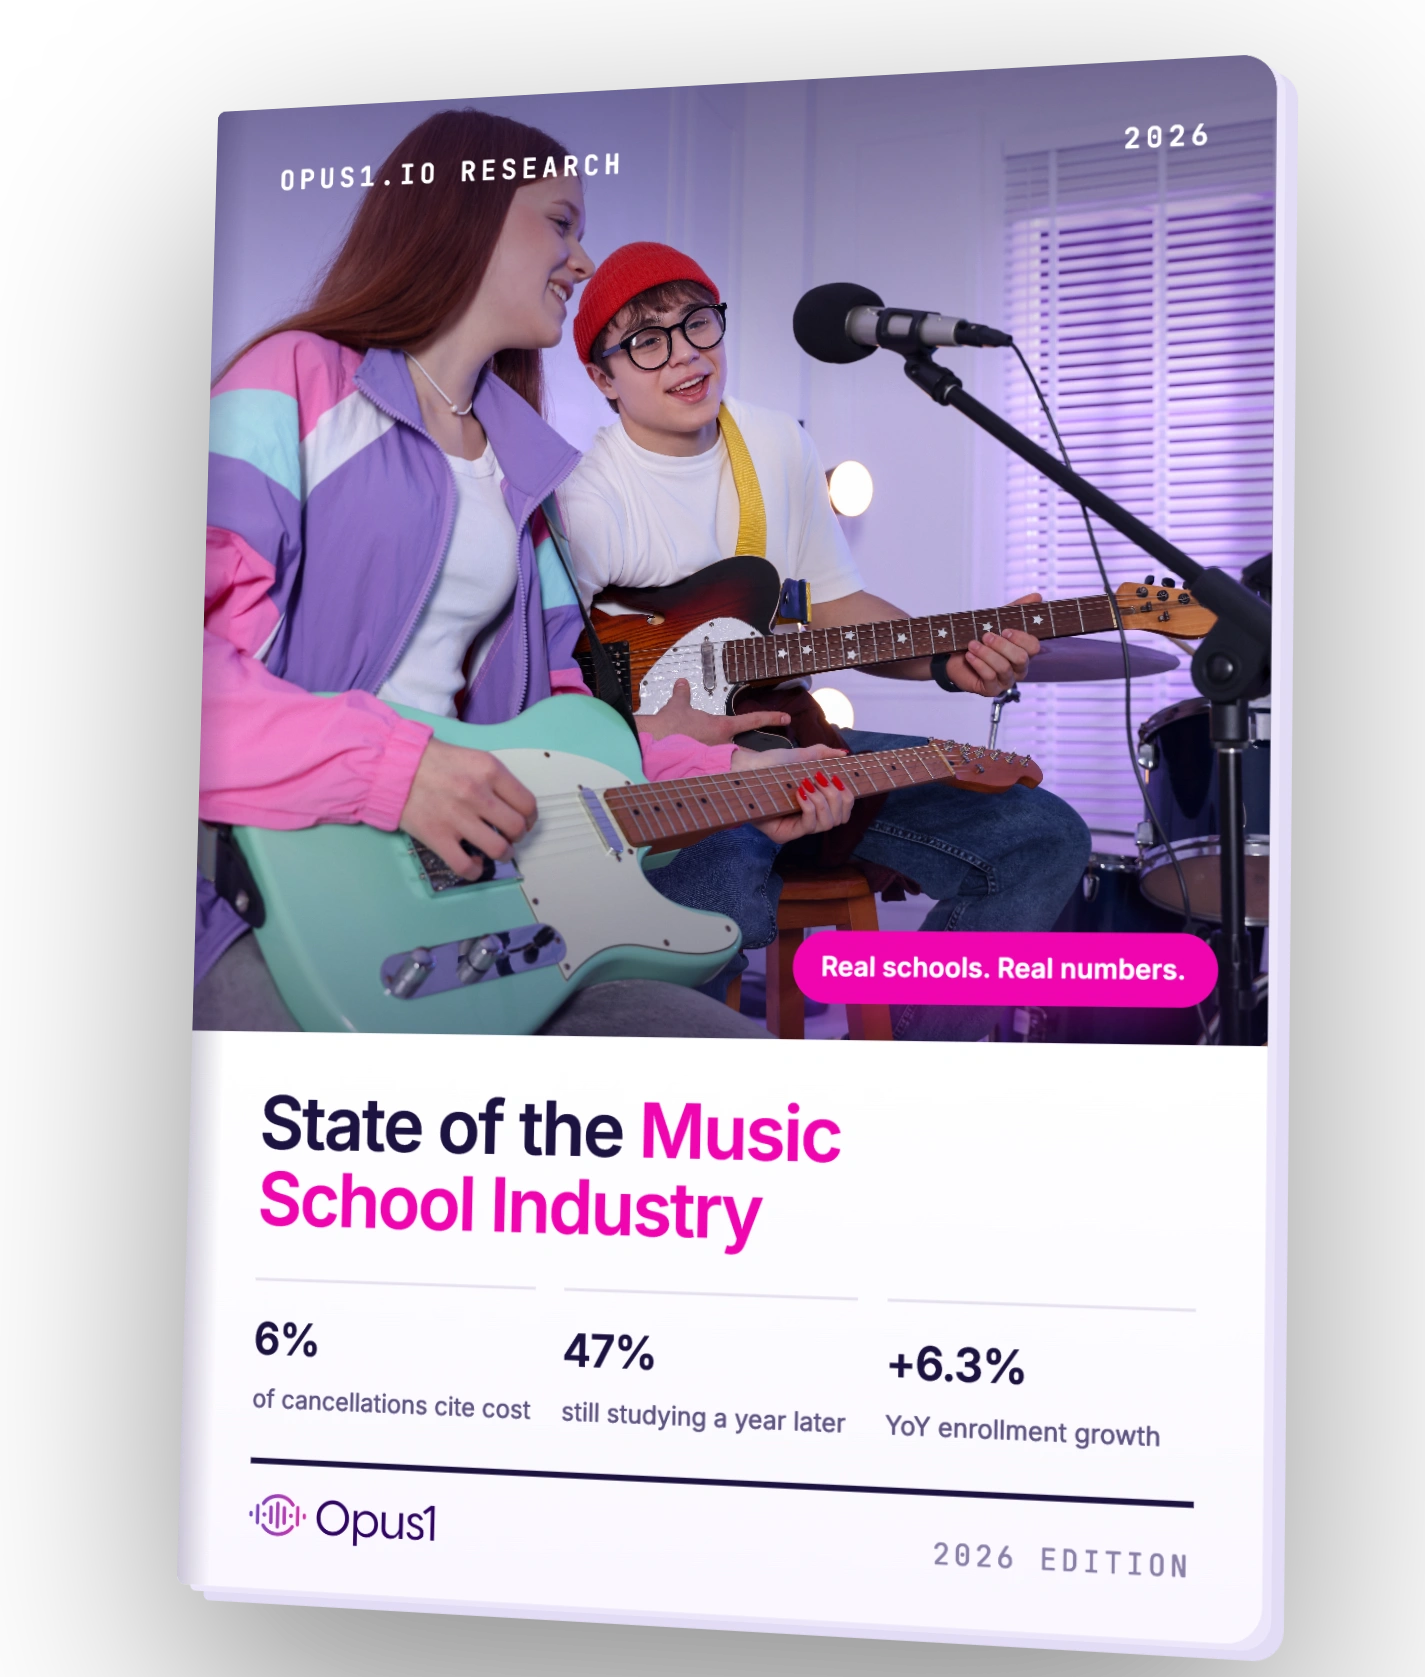
The State of the
Music School Industry
See how your school compares on pricing, teacher pay, and retention, and hear what 80 school leaders say is changing this year. Benchmarks and survey data from independent music schools in all 50 states.
Free · PDF
active student enrollments analyzed
independent schools, every US census region
independent schools, every US census region
what families actually pay, not published rate cards
what families actually pay, not published rate cards
school leaders surveyed on what’s changing this year
PREVIEW THE NUMBERS
Three numbers to start.
The rest are in the report.
Every figure comes from live billing, payroll and enrollment records, so you can benchmark against how schools actually operate.
of cancellations actually cite cost as the reason
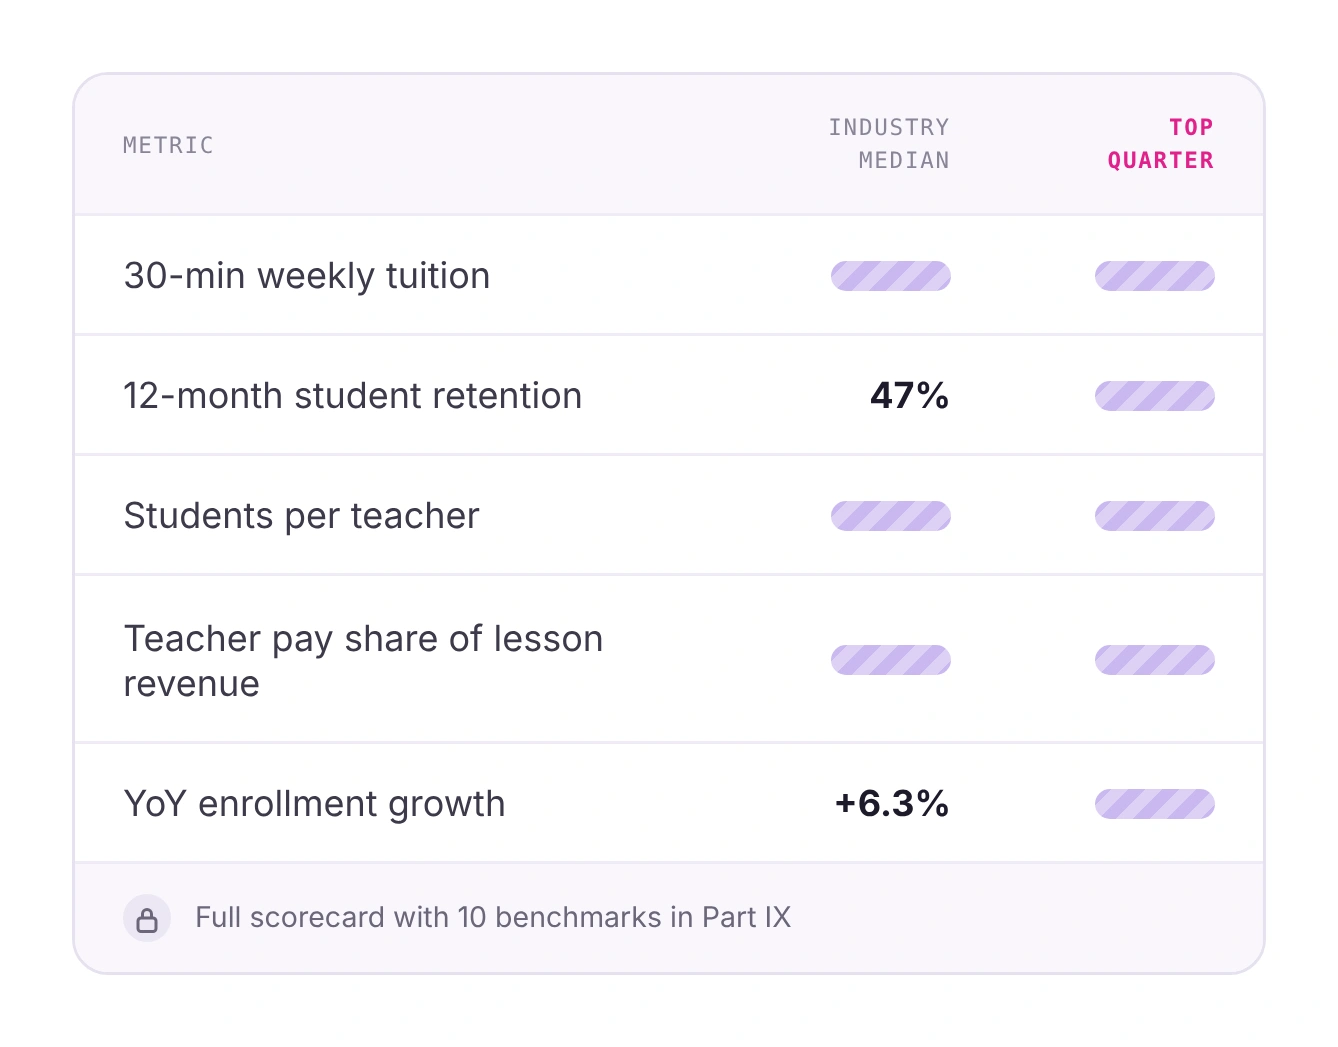
of new students are still studying a year later
median year-over-year enrollment growth for schools
median tuition for a weekly 30-minute private lesson
teacher pay by lesson type, school size, and region
of students who cancel come back within a year
WHAT’S INSIDE
Nine parts.
Every number a school
owner plans around.
What lessons cost
Tuition by lesson length, region, school size and billing model, plus the most profitable slot on the schedule.
What students study
The instrument league table, and the demand a narrow catalog leaves on the table.
What teachers earn
Pay structures, regional rates, teacher load and the payroll share of every lesson.
The life of a student
How long students really stay, and the window where the lesson habit forms or fades.
Why students leave, and who comes back
Stated cancellation reasons and the timing of a well-placed win-back.
What separates high-retention schools
The pricing, billing and teacher-assignment patterns behind the schools that keep students longest.
Growth and the shape of a school
Who grew last year, who shrank, and what a typical school looks like by the numbers.
The school leader’s view
What 80 school leaders had to say about budgets, teacher shortages, AI, and more.
Benchmark yourself
A one-page scorecard against the industry median and its strongest quarter.
FINDINGS
Some of what owners assume
about pricing and retention
doesn’t hold up.
Cheap lessons churn fastest.
Budget pricing buys volume, not loyalty. Part VI shows how wide the lifetime-tuition gap between budget and premium schools really is.
Time, not money, ends most enrollments.
Cost ranks far behind scheduling pressure among stated reasons for leaving. See what that means for your next price increase.
The summer cliff is softer than it looks.
Many May and June cancellations are a pause, not a goodbye. The report shows how many return, and when to start the conversation.
Teacher assignment is a retention decision.
Which teacher a new student lands with is one of the strongest predictors of whether they stay. Part VI explains the pattern.
FREE REPORT
Be first to get the report.
Reserve your copy now and we will email the PDF the day it is released.